Source Category Analysis
Your coverage is not all one kind of media. A mention in a national broadsheet, a trade title, a government bulletin and an aggregator each carries a different audience and a different kind of influence. Source Category Analysis sorts your coverage by the kind of editorial enterprise behind it, so you can see where your brand is genuinely strong and where the numbers are quietly inflated.
What it does
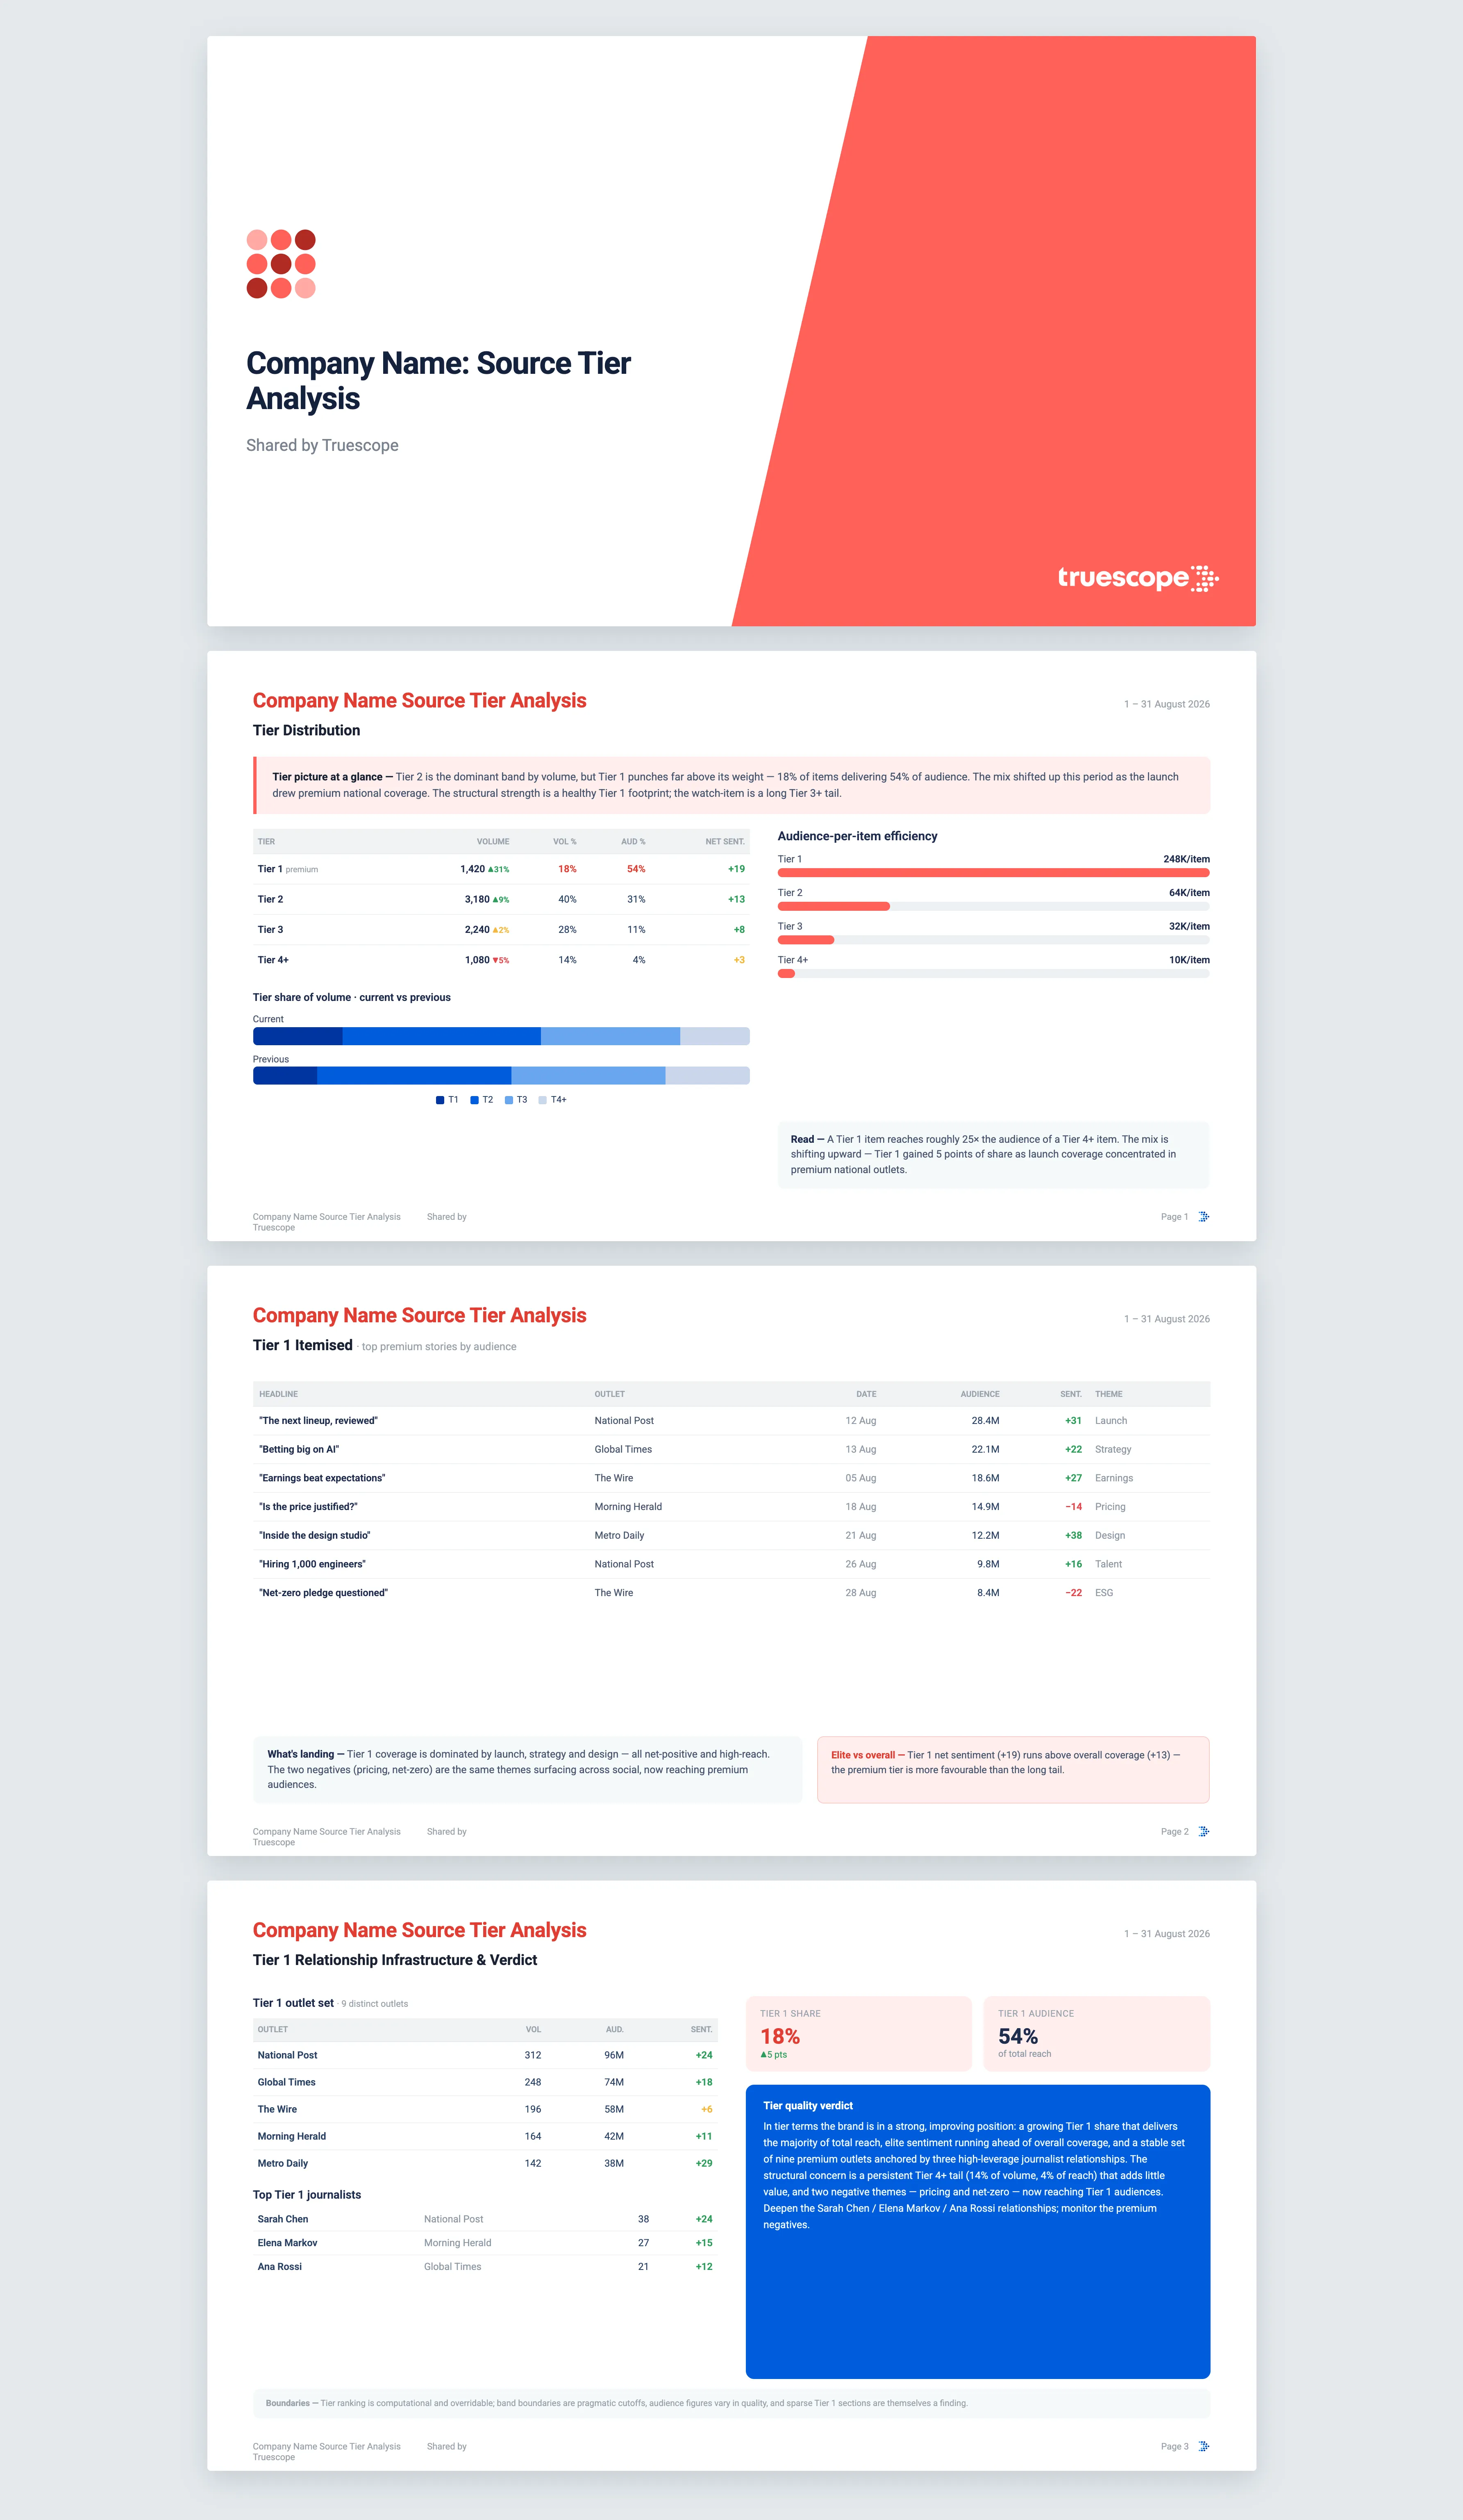
This template answers a question that headline volume hides: across the kinds of sources covering your brand, how are volume and sentiment actually distributed, and what does that mix say about coverage quality and audience. It separates mainstream news from trade press, opinion platforms, blogs, aggregators, regional outlets, investigative shops and official government and corporate information. Source category is distinct from authority tier, so a respected trade journal and a national newspaper can both be high quality yet reach completely different rooms. The result is a structural read on the editorial company your brand is keeping.
The questions it answers
- Which kind of media is doing most of the talking about us, and which is barely present?
- How much of our reported volume is original reporting versus the same story republished by aggregators?
- Is our trade and industry coverage growing, and what is the sentiment there compared with mainstream news?
- Are opinion and editorial platforms framing us positively or critically, and along what political lines?
- Do we have any investigative or official government coverage in the period, and what does it say?
What's in the report
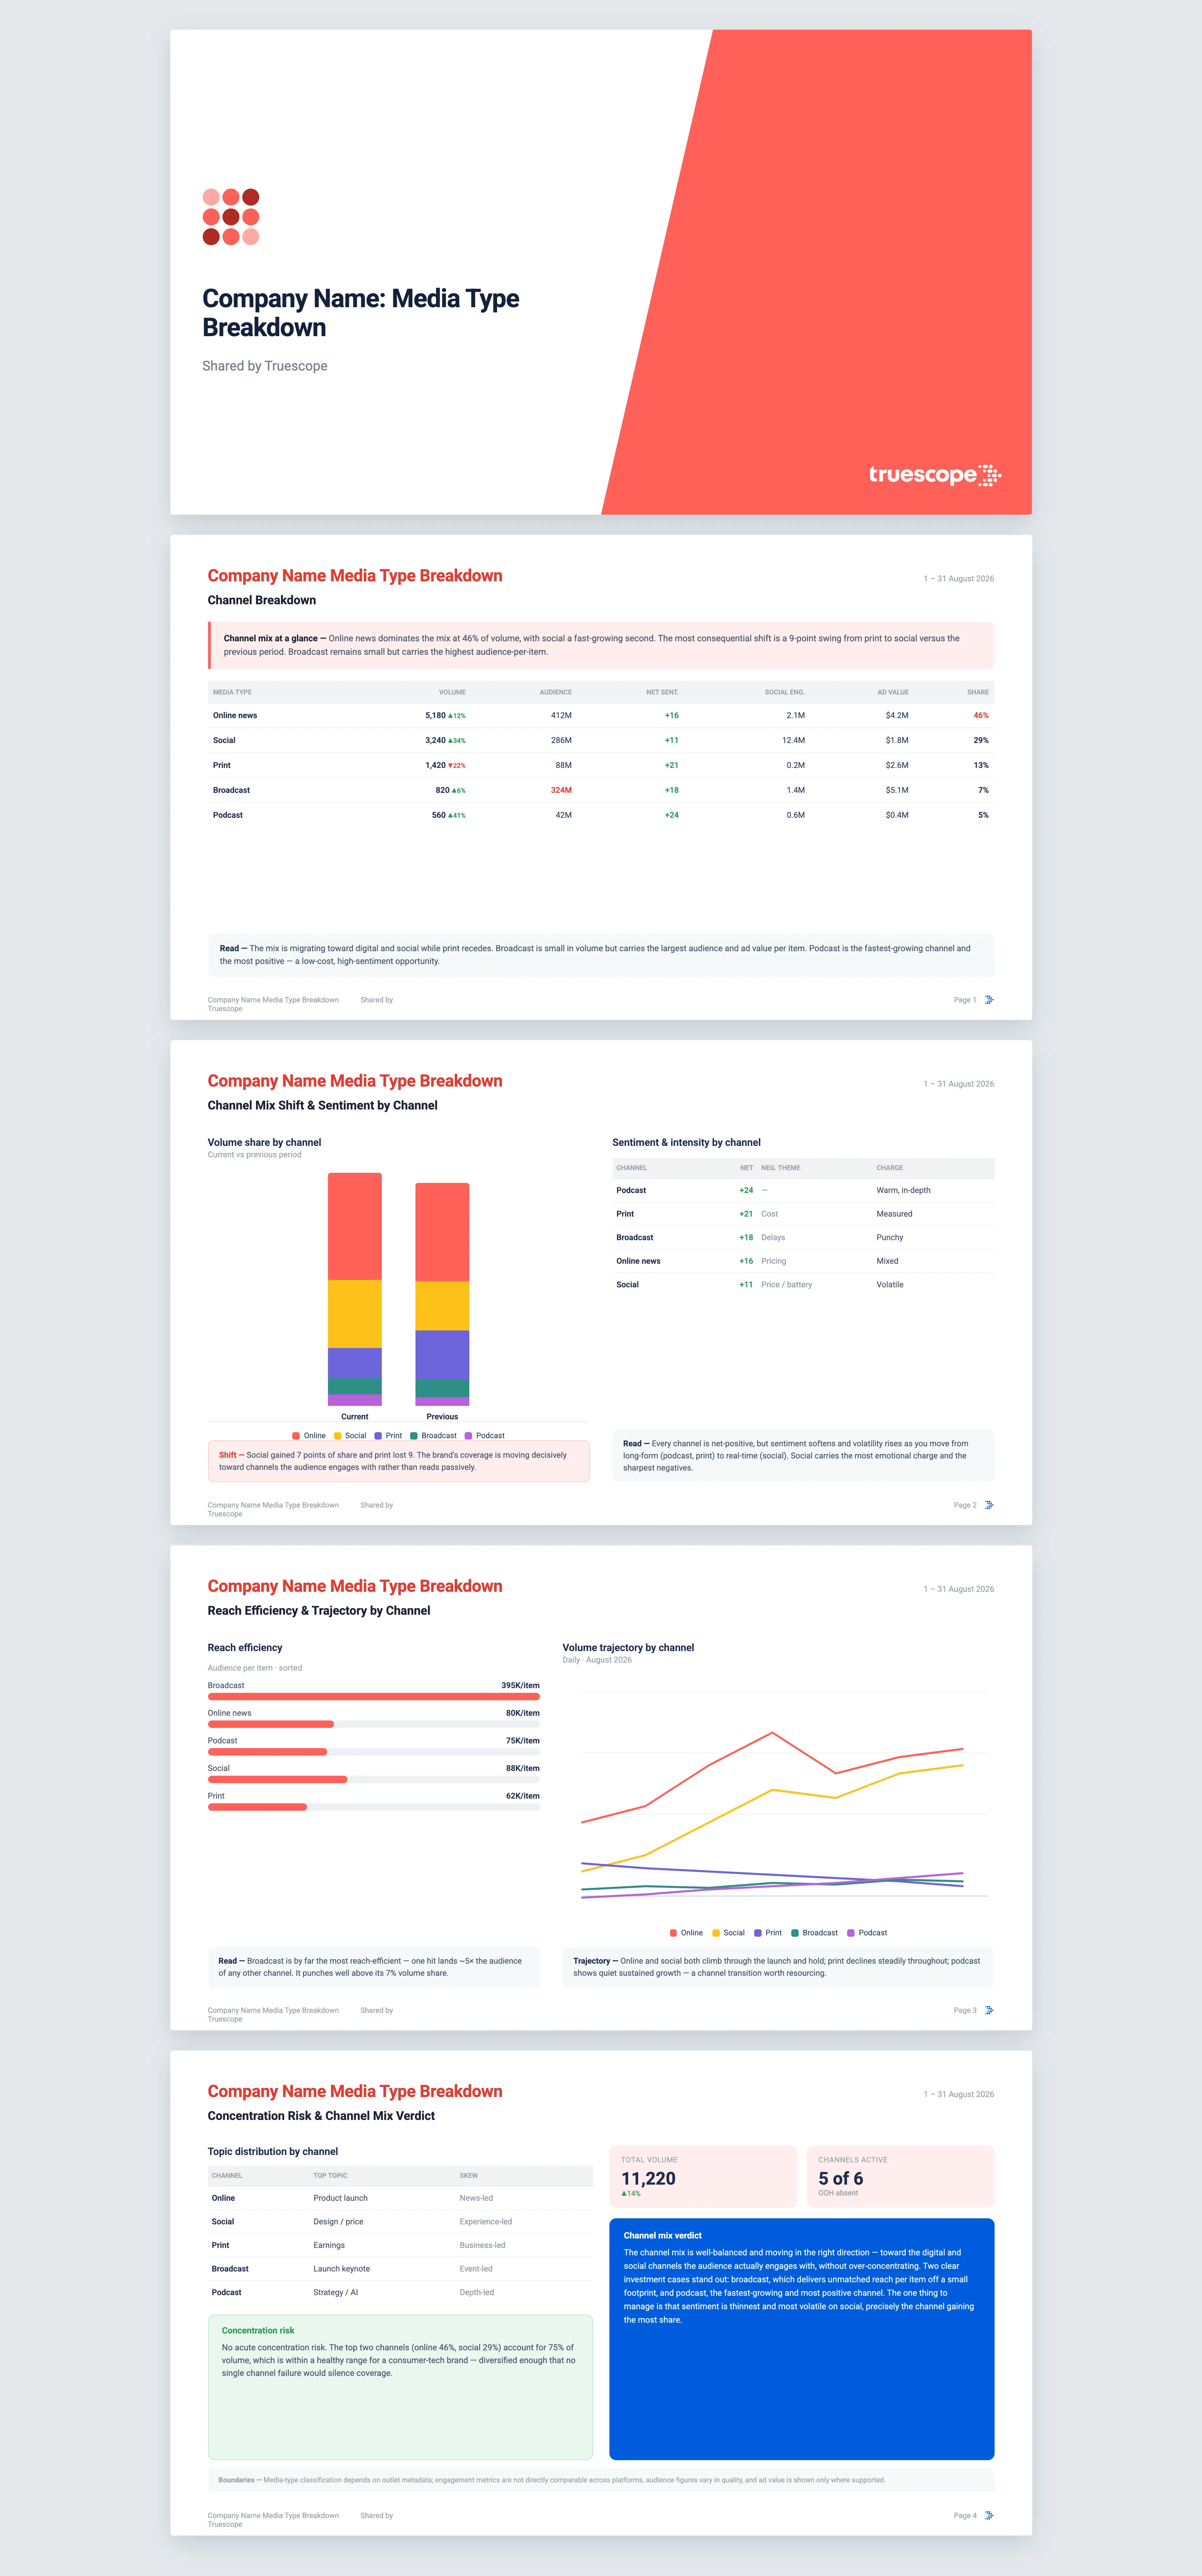
The report opens with a plain-language read of your category picture, then builds out the evidence. You get a full category breakdown table with volume, share, audience, net sentiment, intensity and social engagement, every category compared against the immediately preceding period of equal length. A stacked category mix chart shows how the mix has shifted period over period.
From there it goes deeper:
- A category-by-channel cross-tab showing which categories show up in which media types, so you can tell mainstream broadcast from mainstream online from trade online.
- Sentiment and dominant themes per category, plus an audience reach efficiency table ranking categories by audience per item.
- A dedicated industry and trade penetration deep-dive, especially useful for B2B brands.
- An aggregator and republishing breakdown that deduplicates syndicated pickup, so you see original stories against republished volume and the syndication multiplier behind your numbers.
- Full enumeration of any investigative journalism and any government or corporate information items, each with headline, outlet, date, audience and sentiment.
Every figure is cited back to the source coverage it came from, so any claim can be traced to the items behind it. The report closes with an editorial verdict on where your category presence is strong, where you are over- or under-represented, and what that means structurally.
Who it's for
This is built for communications and PR leaders who need to explain coverage quality to executives or the board, not just report a tally. It suits B2B and corporate teams who care about trade and industry standing, public affairs teams watching for official and government coverage, and anyone who suspects their volume is being padded by aggregator republishing.
Why Truescope Analyst
Classifying a few hundred clippings by source type by hand is slow and inconsistent, and an agency summary rarely shows its working on which outlets it grouped where or how much was just the same wire story repeated. A general-purpose AI chatbot cannot help either, because it only sees the article you paste in. It has no view of your full coverage and no reliable way to tell a trade title from an aggregator at scale.
Truescope Analyst reasons across your entire media dataset, applies a consistent source category taxonomy, deduplicates aggregator pickup, and returns a cited, repeatable analysis in minutes rather than days. It is built into your subscription and available to anyone on the team, so the same category picture can be produced on demand whenever the question comes up.
Frequently asked questions
How far back can this analysis look?
You can analyse up to the last 13 months for coverage already sitting in your Truescope inbox, or the last 90 days for global data not yet matched to your workspace. Each run also compares your chosen window against the equivalent period immediately before it.
Can I compare my category mix to a competitor?
Yes. If you supply a competitor brand or an existing workspace query, the report adds a category gap view showing where you lead, where they dominate, where you reach parity and where your brand is absent from a category entirely.
Does the analysis tell me whether my category mix is right for my strategy?
No, and that is deliberate. The template describes the source-type mix and flags where you are over- or under-represented, but it does not judge whether that mix suits your strategy. That call stays with you and your team.