Media Type Breakdown
A brand that lives 90 per cent online and barely registers on broadcast is reaching a different audience, in a different way, than one with the opposite mix. Media Type Breakdown makes your channel mix explicit, showing where your coverage actually lands across online, broadcast, print, podcasts and social, and where you are structurally strong or absent.
What it does
This template answers a structural question that aggregate numbers tend to bury: across all the media types where your coverage appears, how are volume, reach and sentiment distributed, and where are you strong or weak by channel. It breaks your coverage into each media type, then compares that mix to the previous period and, where you want it, to a competitor. Channel mix is not a detail. It shapes which audiences hear about you and how they relate to you, so the diagnostic value is in seeing the mix laid out plainly rather than leaving it hidden inside one big total.
The questions it answers
- Which channel is carrying most of our coverage, and are we dangerously concentrated in one or two?
- Where are we getting the most reach for each piece of coverage, and where are we generating noise with little audience?
- Which social platforms are actually working for us, judged by their own native engagement signals?
- Is a competitor present on a channel where we are structurally absent?
- Is any channel quietly rising or fading, like broadcast giving way to podcasts?
What's in the report
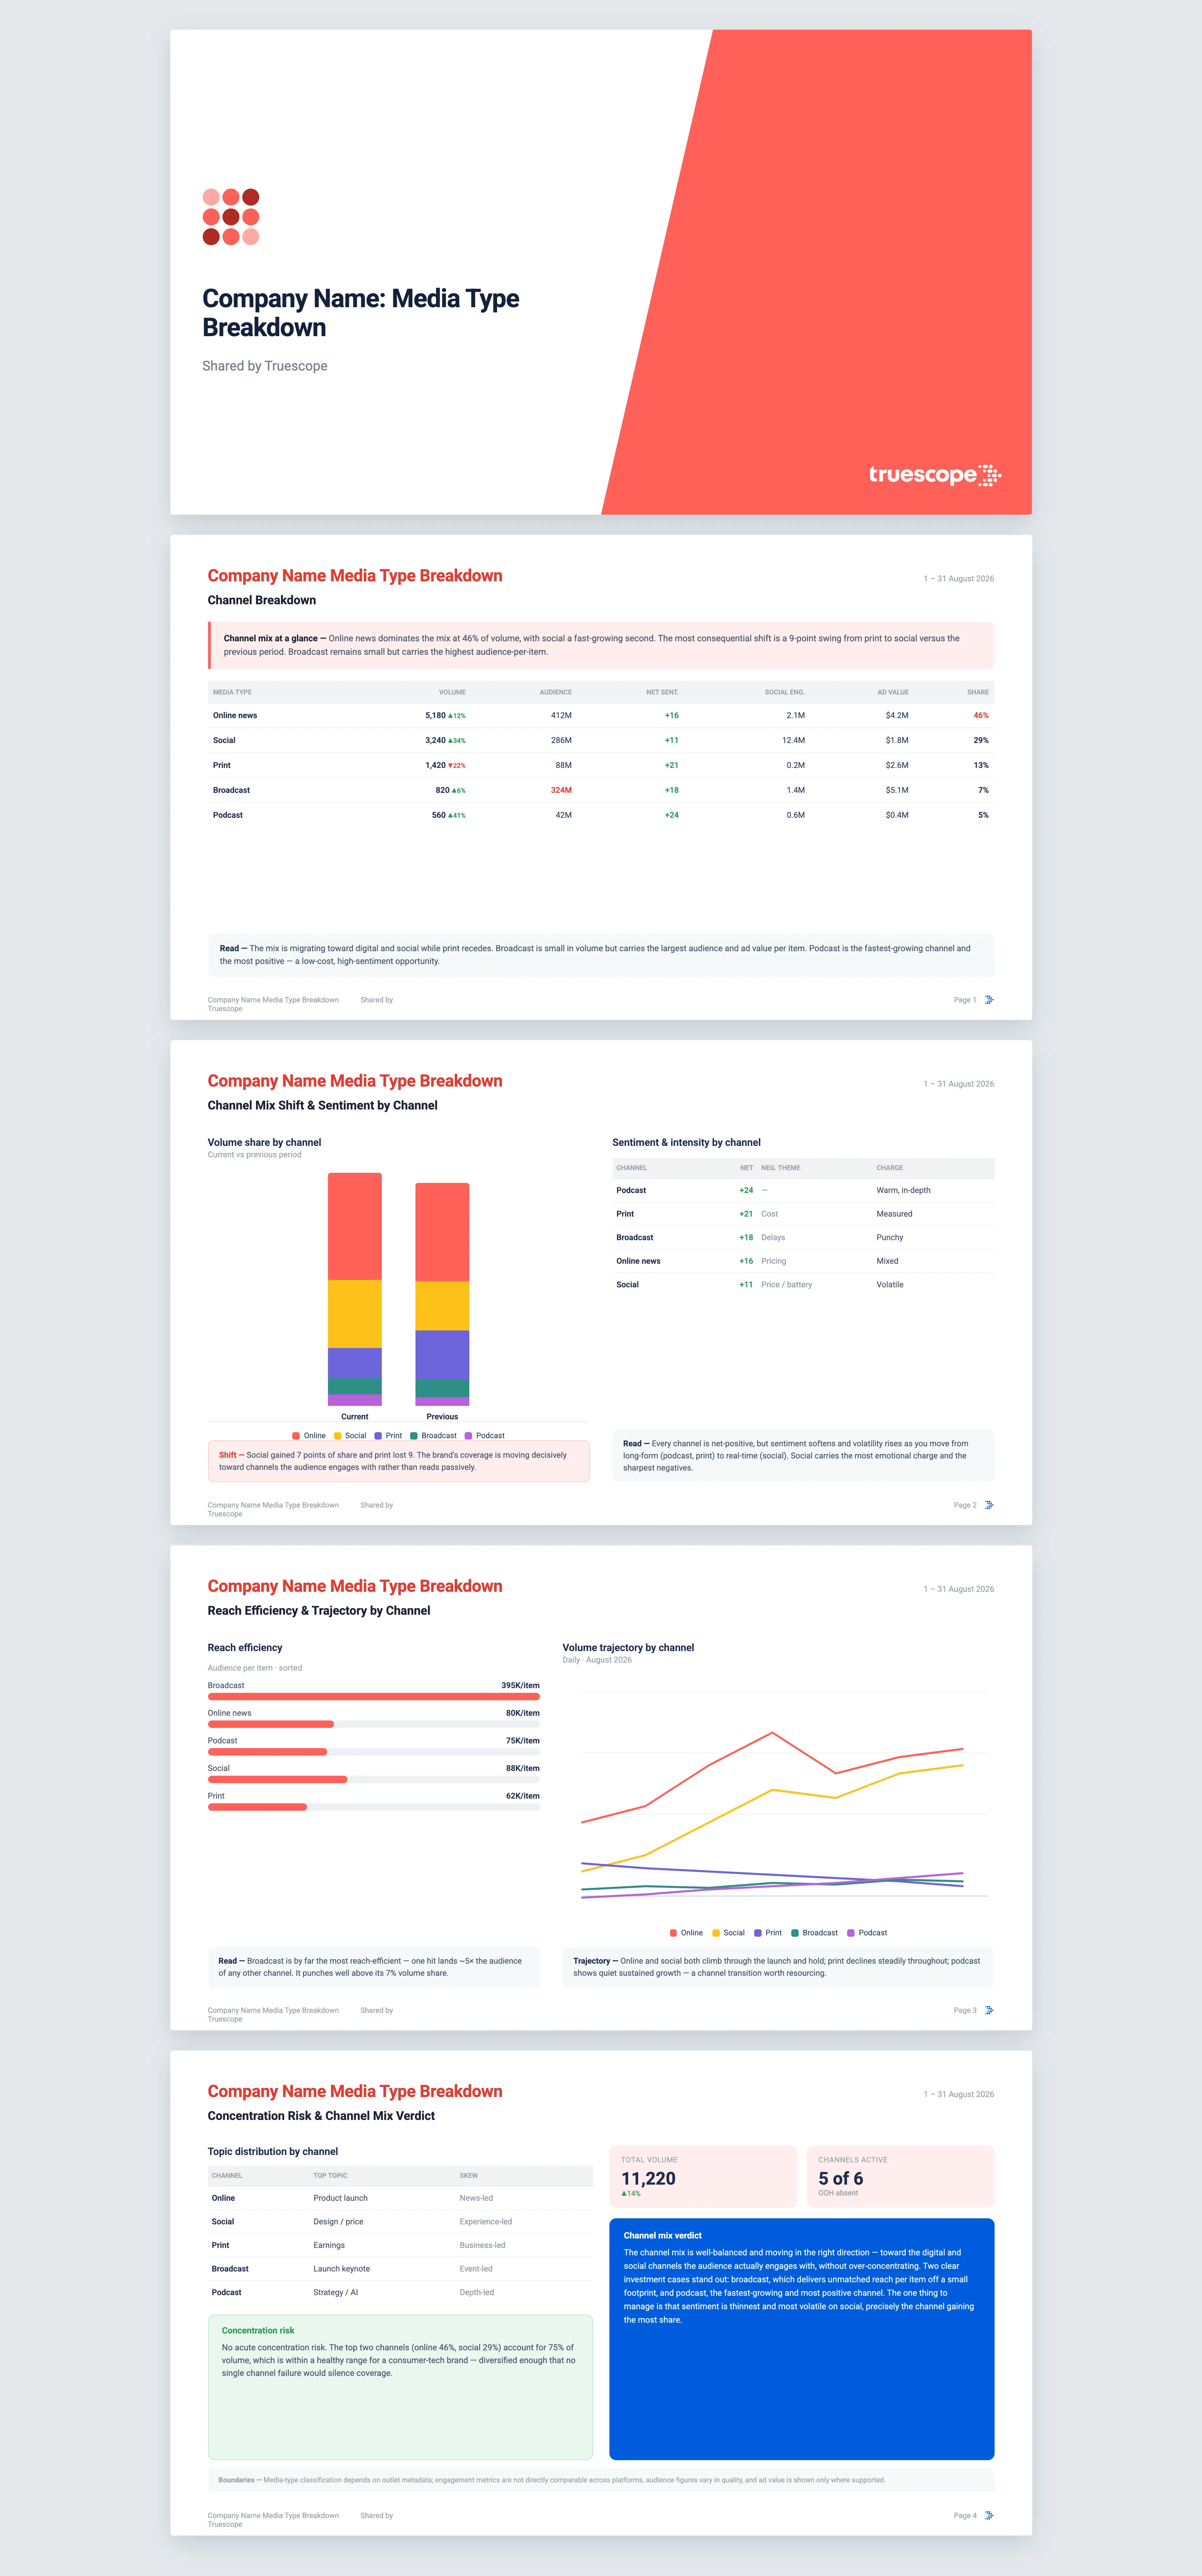
The report opens with a four-to-six sentence read of your channel mix, naming the dominant channel, how concentrated you are, and the most consequential shift since the previous period. A full channel breakdown table follows, with volume, change, audience, sentiment, intensity, engagement and ad value where available, and any channel with no presence is listed as "Absent" rather than dropped, because absence is itself a finding. A grouped bar chart compares current and previous period side by side.
It then takes each channel apart:
- Per-platform social granularity using each platform's own metrics, since virality on one platform does not mean the same thing as on another.
- Sentiment and intensity by channel, surfacing where print stays analytical and social runs to extremes.
- Reach efficiency by channel, ranked by audience per item.
- Source quality within each channel, flagging where a channel skews toward lower-tier outlets.
- Topic distribution by channel, and a trajectory line chart showing each channel over the period.
- A channel concentration risk flag if too much of your coverage sits in one or two places.
Cross-platform engagement comparisons are framed as approximate, since each platform's signals mean different things. Every finding is cited back to the source coverage behind it, and the report closes with an editorial verdict on where your mix fits, where it has gaps, and where you might invest.
Who it's for
This suits communications and marketing leaders who need to know whether their coverage is reaching the right audiences through the right channels, not just how much there is. It helps teams planning channel investment, anyone worried about over-reliance on a single platform, and leaders preparing a clear channel story for executives or the board.
Why Truescope Analyst
Building a channel breakdown by hand means tagging every item by media type and then doing it again next quarter, and most spreadsheets cannot hold each social platform's native metrics side by side. Agency decks often collapse all of social into one figure, which hides which platform is actually performing. A general AI assistant cannot help here, because it has no sight of your broadcast, print and social coverage together and only reads the one item you give it.
Truescope Analyst reasons across your full dataset, keeps each platform's native signals disaggregated, flags concentration risk, benchmarks against a peer on request, and returns a cited, repeatable breakdown in minutes. It is part of your subscription and open to anyone on the team, so the channel picture is always a few minutes away.
Frequently asked questions
What period can the breakdown cover?
You can analyse up to the last 13 months for coverage already in your Truescope inbox, or the last 90 days for global data not yet matched to your workspace. Each run compares your window against the equal period immediately before it and can chart each channel's trajectory across the window.
Can I compare my channel mix to a competitor or a single market?
Yes. Supply a competitor brand or workspace query and the report adds a channel gap view that flags where a rival is present and you are absent. You can also apply a geographic filter for a single-market cut.
Are the social engagement numbers comparable across platforms?
Not directly, and the report says so. Each platform's likes, shares and views carry different audience meaning, so the report keeps platforms separate and treats any cross-platform comparison as approximate.