Social Competitive Comparison
A multi-player benchmark spreads your attention thin. A head-to-head zooms in. Social Competitive Comparison puts your brand and one named competitor side by side, platform by platform, and tells you who is winning, on what dimensions, and why.
What it does
This template runs a granular, two-player social comparison between your brand and a single named competitor. The strategic question is who is winning on each platform, on which dimensions, and what the head-to-head reveals about social positioning, audience engagement and platform strategy.
Because it focuses on just two players, it can go deep: per platform, per engagement type, per content type. Rather than a single overall winner, it shows where each player leads, where the gap is widening, and where it is closing, so you understand not just the current standing but the direction of travel.
The questions it answers
- Who leads on each platform, and on which specific dimensions of volume, engagement, sentiment and reach?
- Where is the gap between us and the competitor widest, and where is it narrowing?
- How do our content strategies differ in cadence, format mix and theme emphasis?
- Do we and the competitor compete on the same platforms, or lead on different ones?
- Which influencers and hashtags cover the competitor that we have no relationship with?
What's in the report
The report opens with a head-to-head read, then works platform by platform with a clear, metric-based winner declared at each step. Every period is benchmarked against the equivalent stretch before it, and findings are cited back to source coverage.
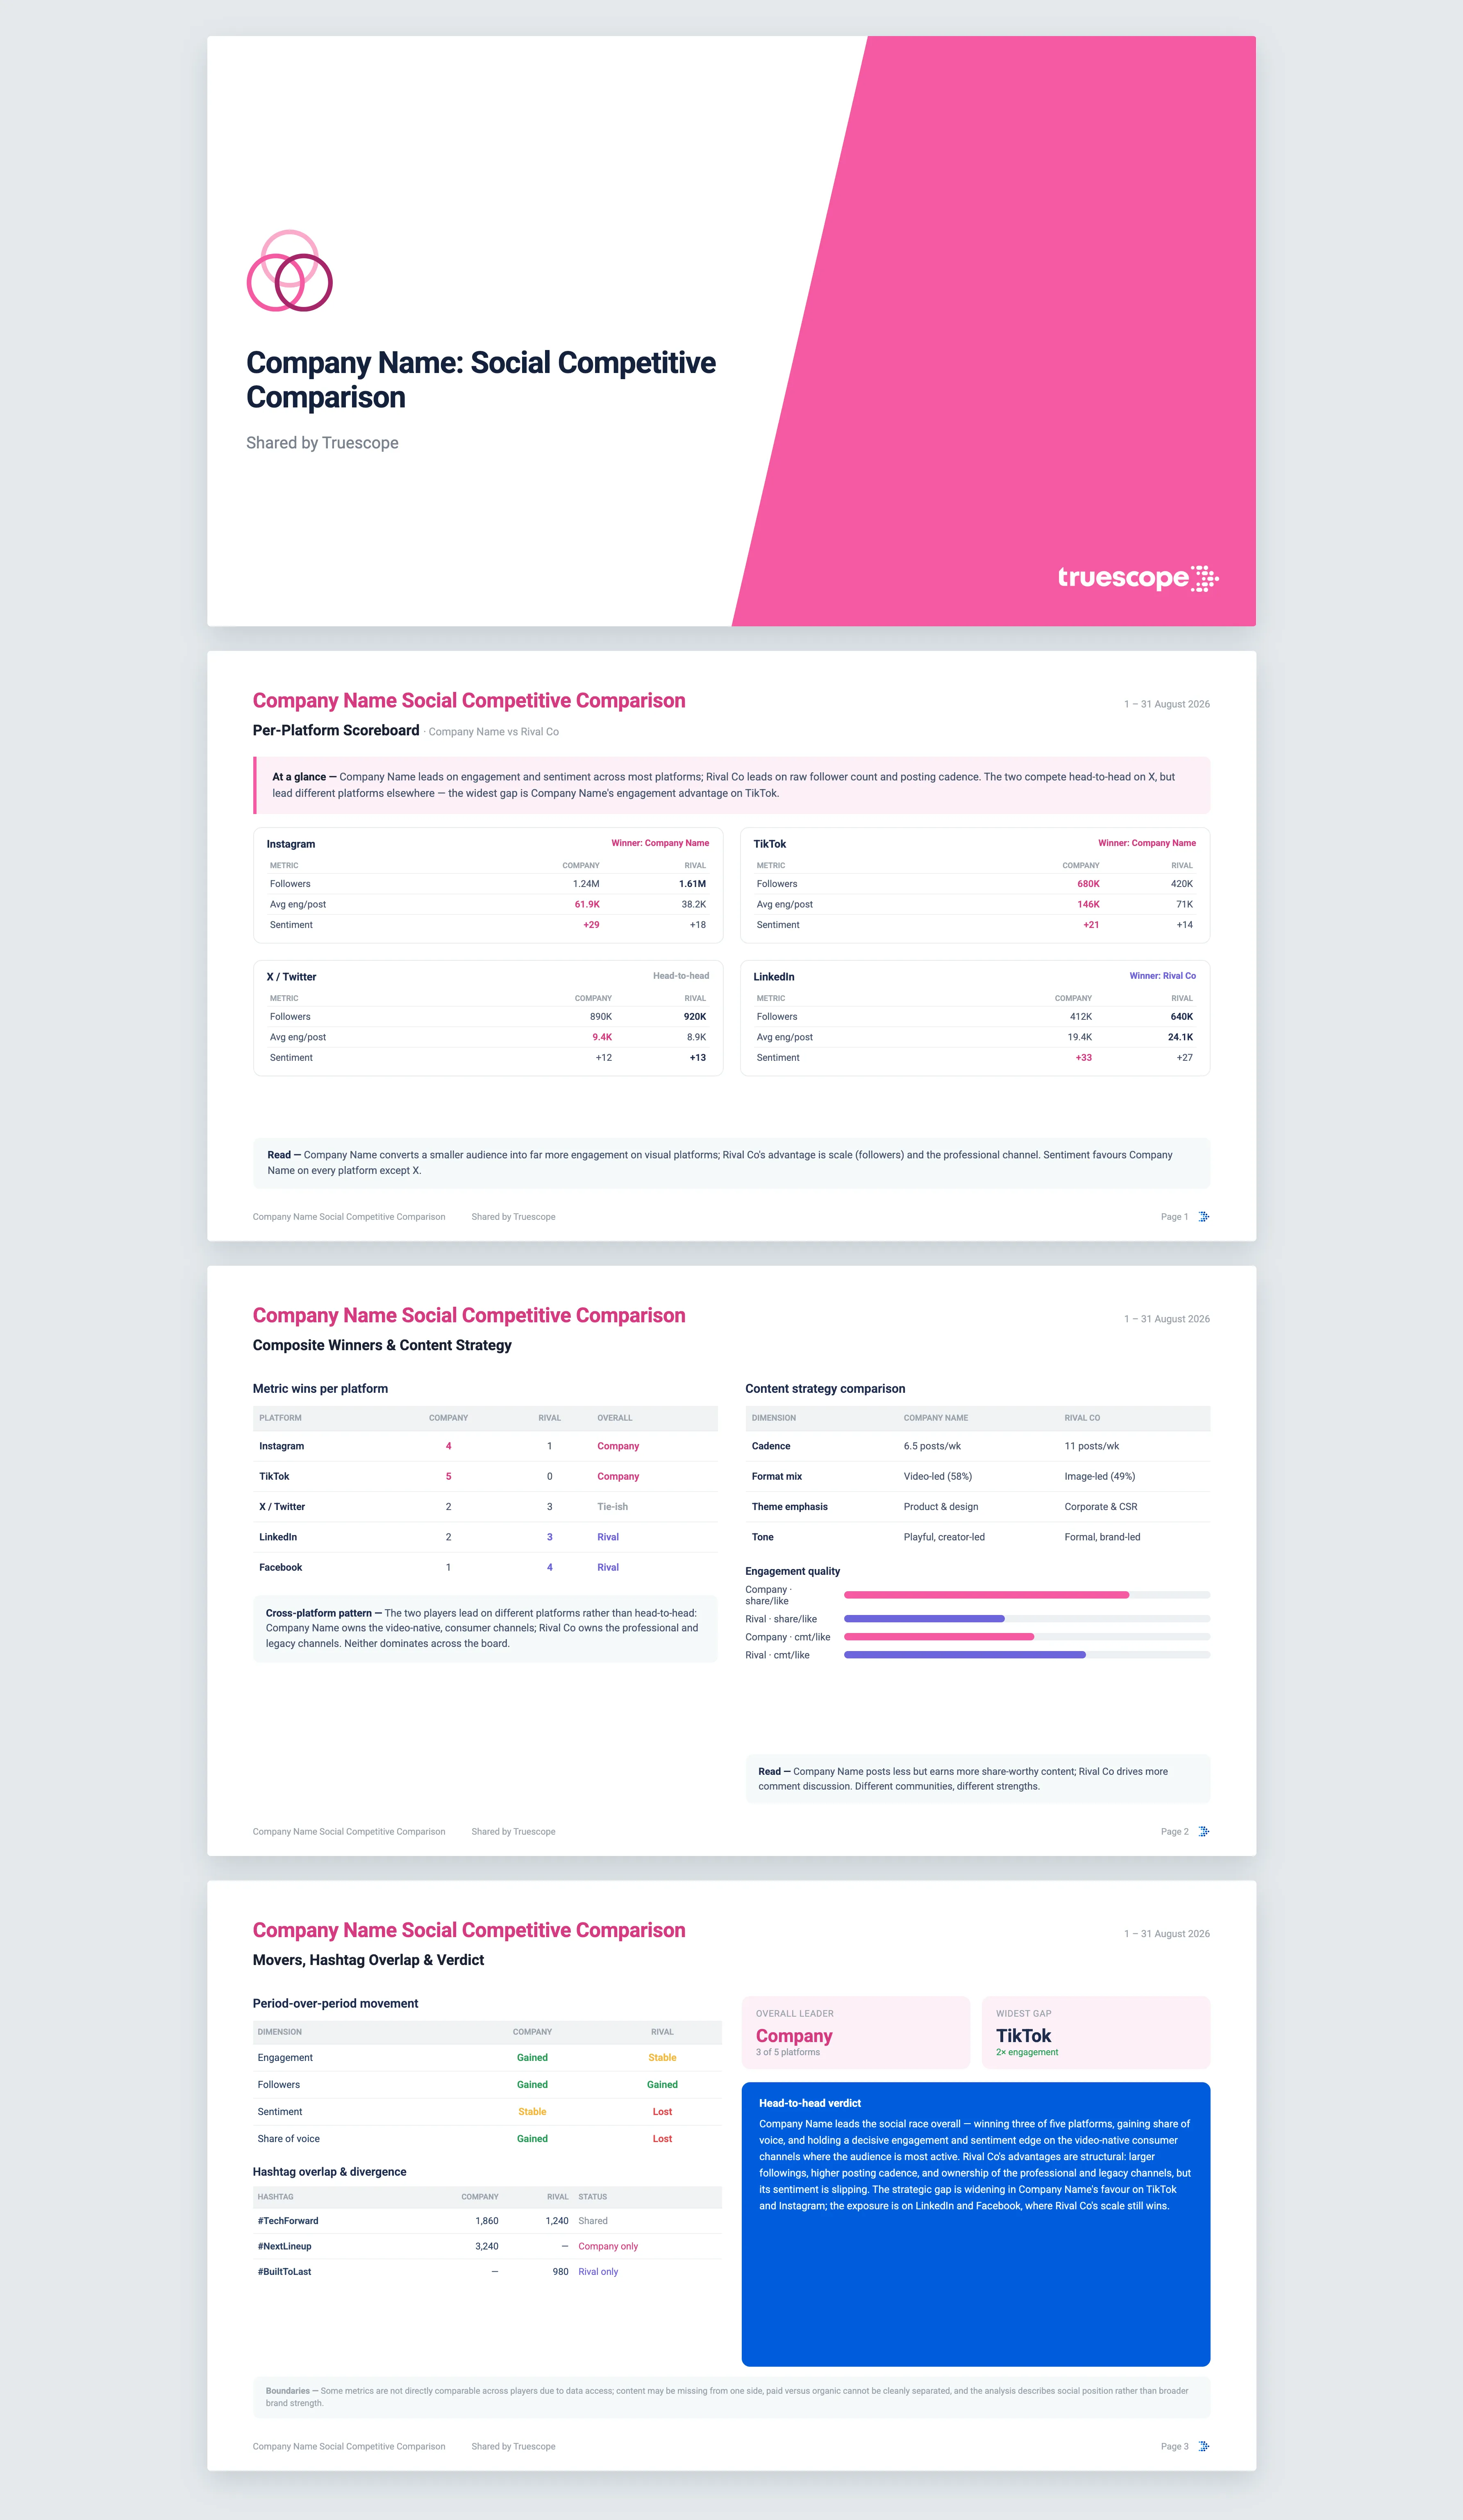
- A per-platform scoreboard comparing both players across mention volume, engagement, sentiment, reach, and, where owned handles are supplied, posts, followers and follower growth, with a winner named on each metric.
- A composite winner table and a cross-platform pattern read, labelled as platform-distinct, platform-overlapping or platform-dominated.
- A content strategy comparison covering posting cadence, format mix and theme emphasis for each player.
- Side-by-side top performing content per platform, engagement-quality comparison, and a sentiment-of-mention-coverage comparison.
- Hashtag overlap and divergence, audience-overlap signals framed as detection rather than definitive measurement, and an influencer comparison showing who covers whom.
- Per-platform narrative themes for each player and a cross-platform consistency read that distinguishes a unified voice from a fragmented, siloed one.
- A mover analysis showing which dimensions each player gained or lost on, which is often more telling than the current standing, and an editorial verdict on where each is heading.
Who it's for
Communications and brand teams who need to know exactly where they stand against a key rival in social. Competitive-intelligence and strategy leads building a defensible head-to-head. Marketing managers deciding where to shift effort, and corporate-affairs professionals who need a clear, sourced comparison to put in front of executives or the board.
Why Truescope Analyst
Building a credible head-to-head by hand means assembling two sets of numbers from platforms that measure things differently, then arguing over which side really won each metric. It is slow, it is contestable, and the mover analysis, the part that shows who is gaining, usually gets dropped for lack of time. A general AI tool cannot help, because it has no access to either player's coverage and no basis for a fair comparison.
Truescope Analyst reads the full body of social coverage for both players, declares winners on a transparent metric-count basis rather than opinion, and foregrounds the period-over-period movement that shows where momentum lies. Every figure is cited back to source coverage, the whole comparison runs in minutes, and it is built into your subscription so the team can rerun it as the rivalry shifts.
Frequently asked questions
What do I need to supply, and can I include owned accounts?
You provide your brand and a single named competitor, each as a workspace query or brand name, plus the platforms to compare across Twitter, Instagram, TikTok, LinkedIn and Facebook. Optionally, you can supply both players' owned account handles, in which case owned-channel performance such as followers and follower growth is brought into the scope.
How are winners decided?
Winners are declared on a metric-count basis, not subjectively: the player leading on the most metrics on a given platform is named that platform's winner, with the rationale stated in a sentence. The cross-platform pattern is then labelled as platform-distinct, platform-overlapping or platform-dominated.
What time range and comparison does it use?
It covers up to the last 13 months for coverage already in your Truescope inbox, or the last 90 days for global data not yet matched to your workspace, with each period benchmarked against the same number of days immediately before. That prior period powers the mover analysis, which shows which dimensions each player has gained or lost on.