Public Service Perception
See how citizens and the media actually perceive a government service, agency, or programme: what is working, what is failing, and where the pressure is building. This template captures citizen voice and grades the service against the dimensions people use to judge it, all in minutes.
What it does
Government services are evaluated on access, fairness, responsiveness, effectiveness, and value for taxpayer money. This template applies that framework to a specific service, agency, or programme, reading public and media perception and breaking it down by the dimensions that matter to citizens. It captures the experiences people report, the concerns and appreciations that dominate, and how perception varies across regions and population groups.
It works from the service you name and the jurisdictions you choose, with optional demographic dimensions where the service has equity considerations such as urban versus rural or by region.
The questions it answers
- How do citizens and the media perceive this service overall, and is perception improving or deteriorating?
- Which dimensions of the service draw concern, and which draw appreciation?
- What are citizens actually experiencing, in their own reported stories and complaints?
- How does perception vary by region and, where relevant, by population group?
- What incidents, reforms, advocacy voices, and trust signals are shaping the narrative?
What's in the report
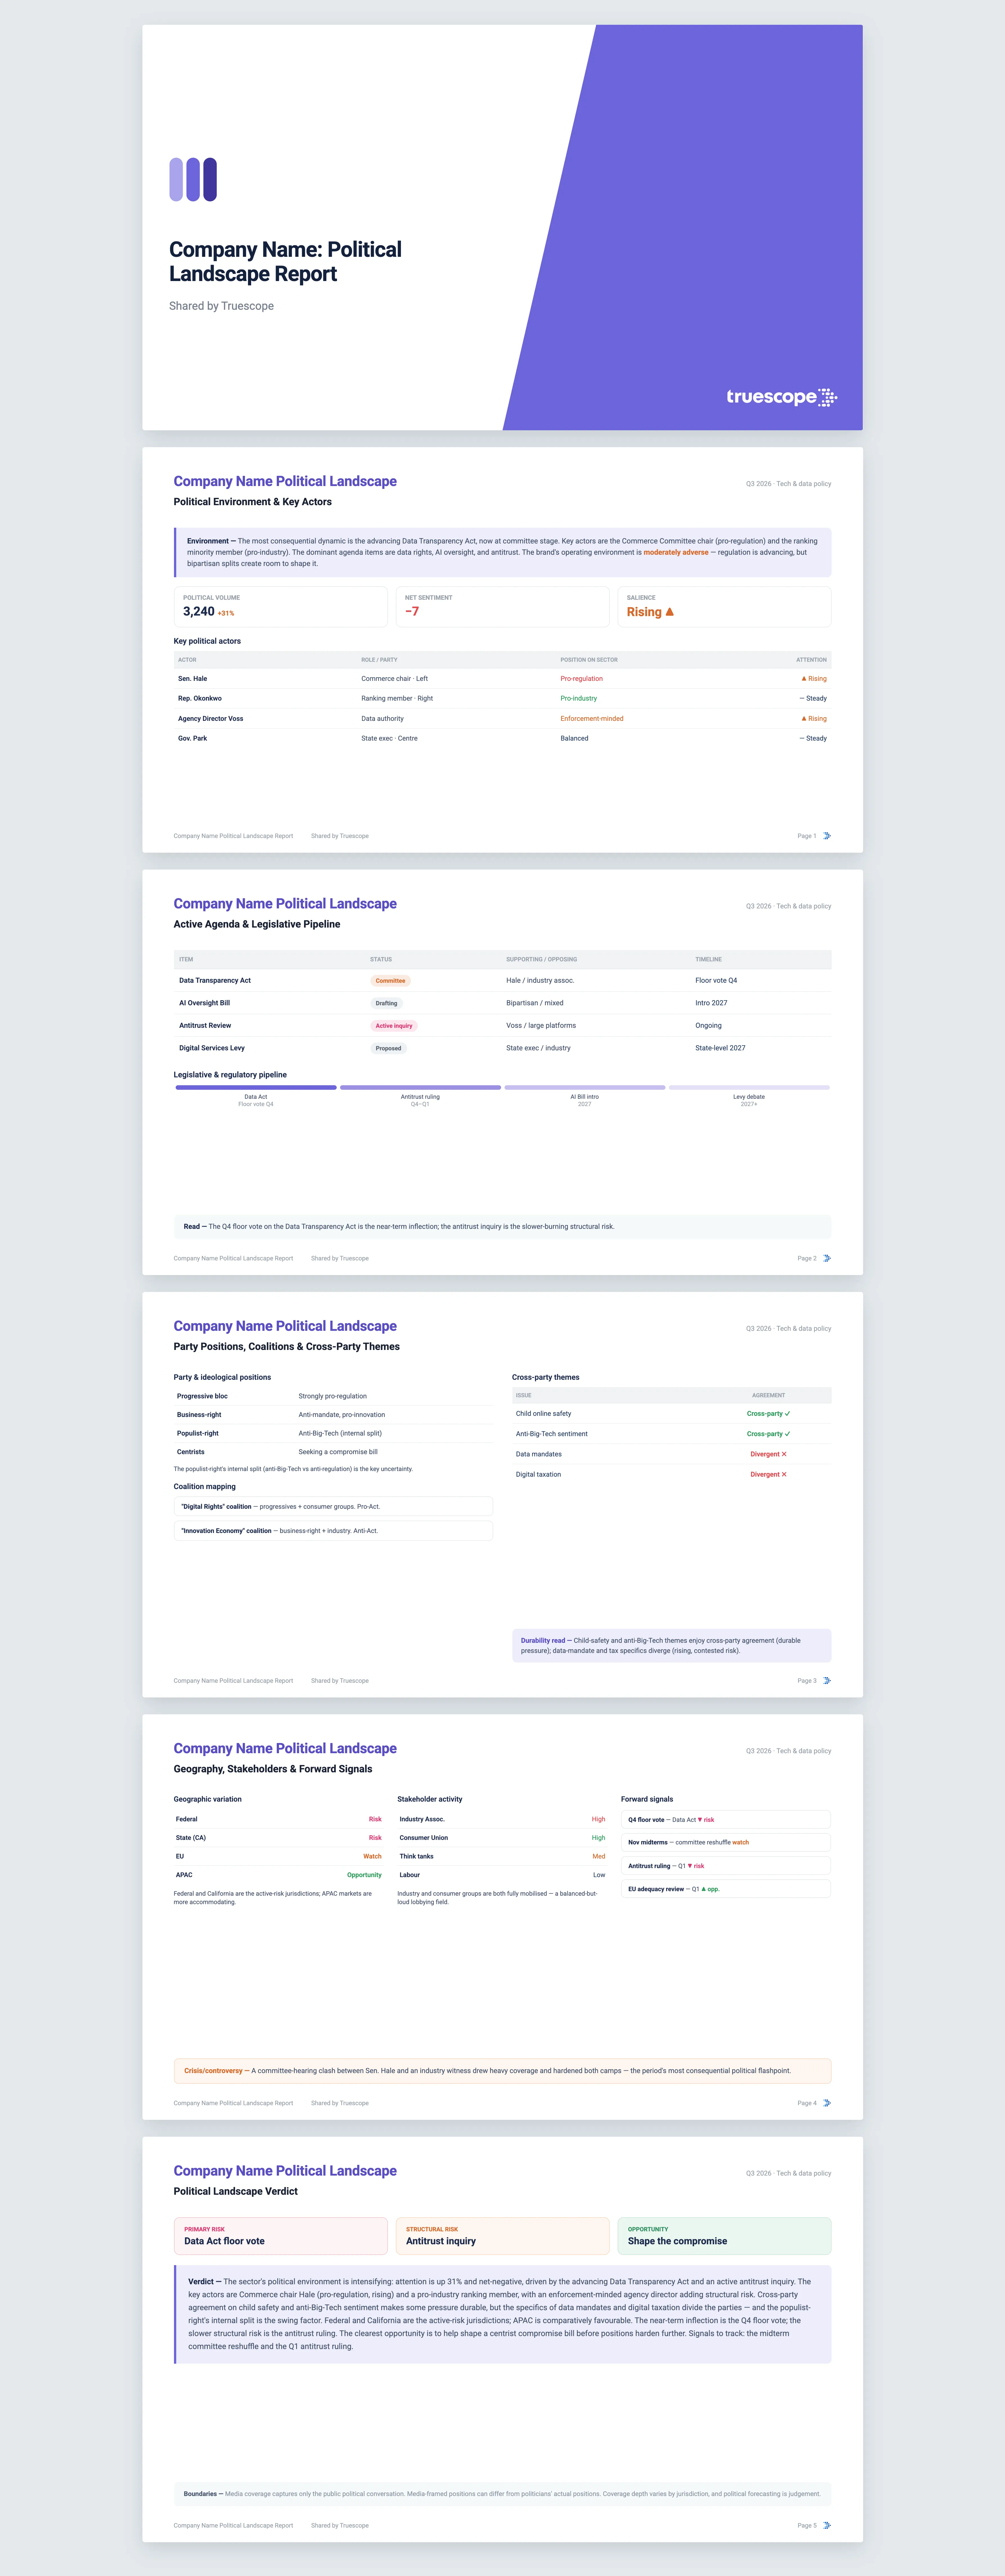
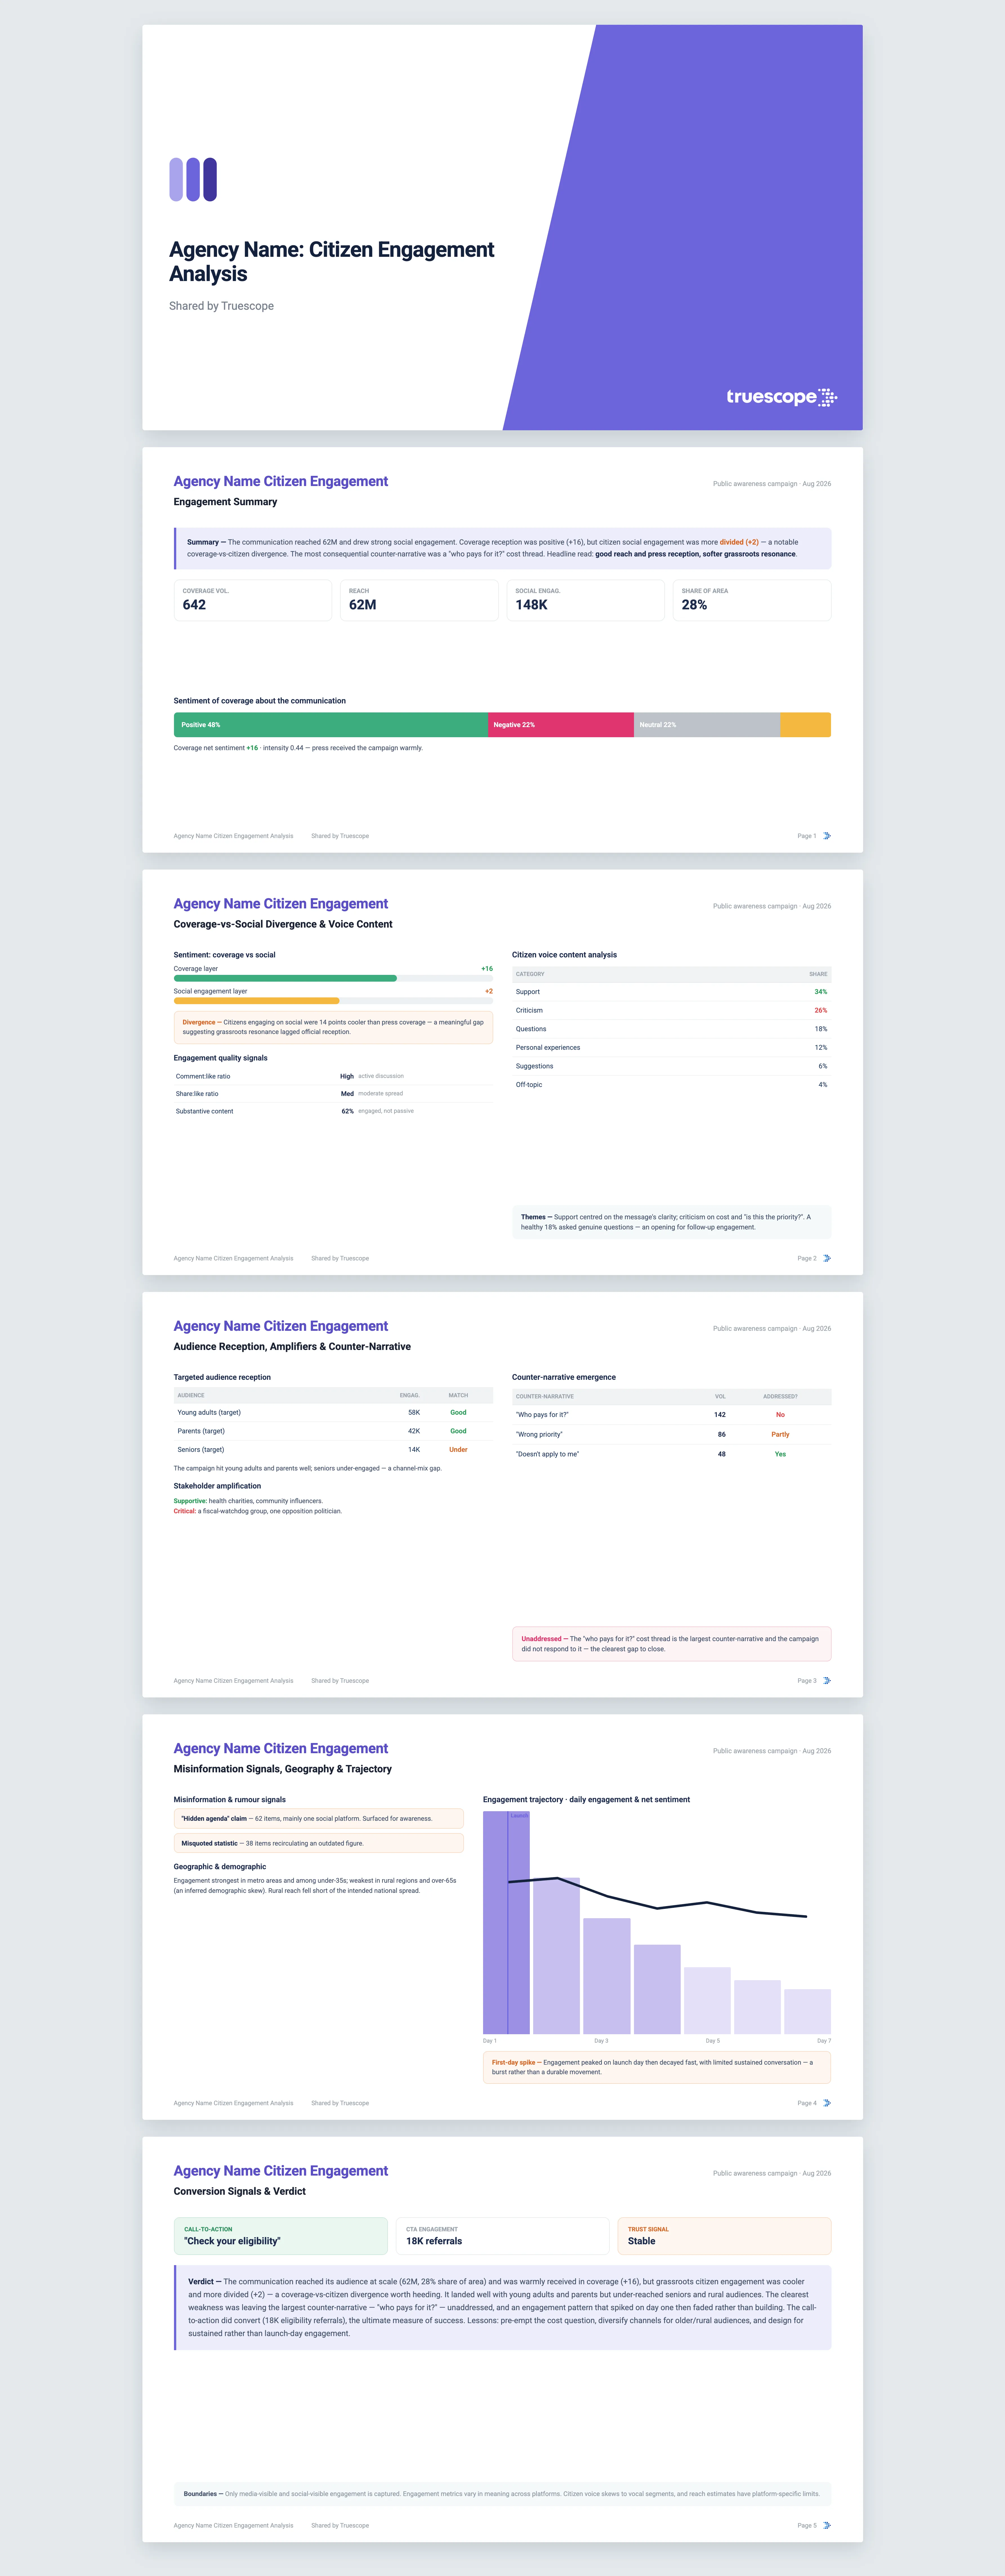
The report opens with a service perception summary and a scoreboard covering volume, change against the comparison period, net sentiment, intensity, and audience reach.
- The top service experience themes, then sentiment broken down across the reserved dimensions: access, wait times, quality, fairness, cost, complexity, communication, and outcomes.
- Citizen voice coverage that surfaces the dominant kinds of reported experience, with representative themes paraphrased to protect individual privacy.
- Service incident coverage and service improvement coverage, plus geographic and demographic equity views.
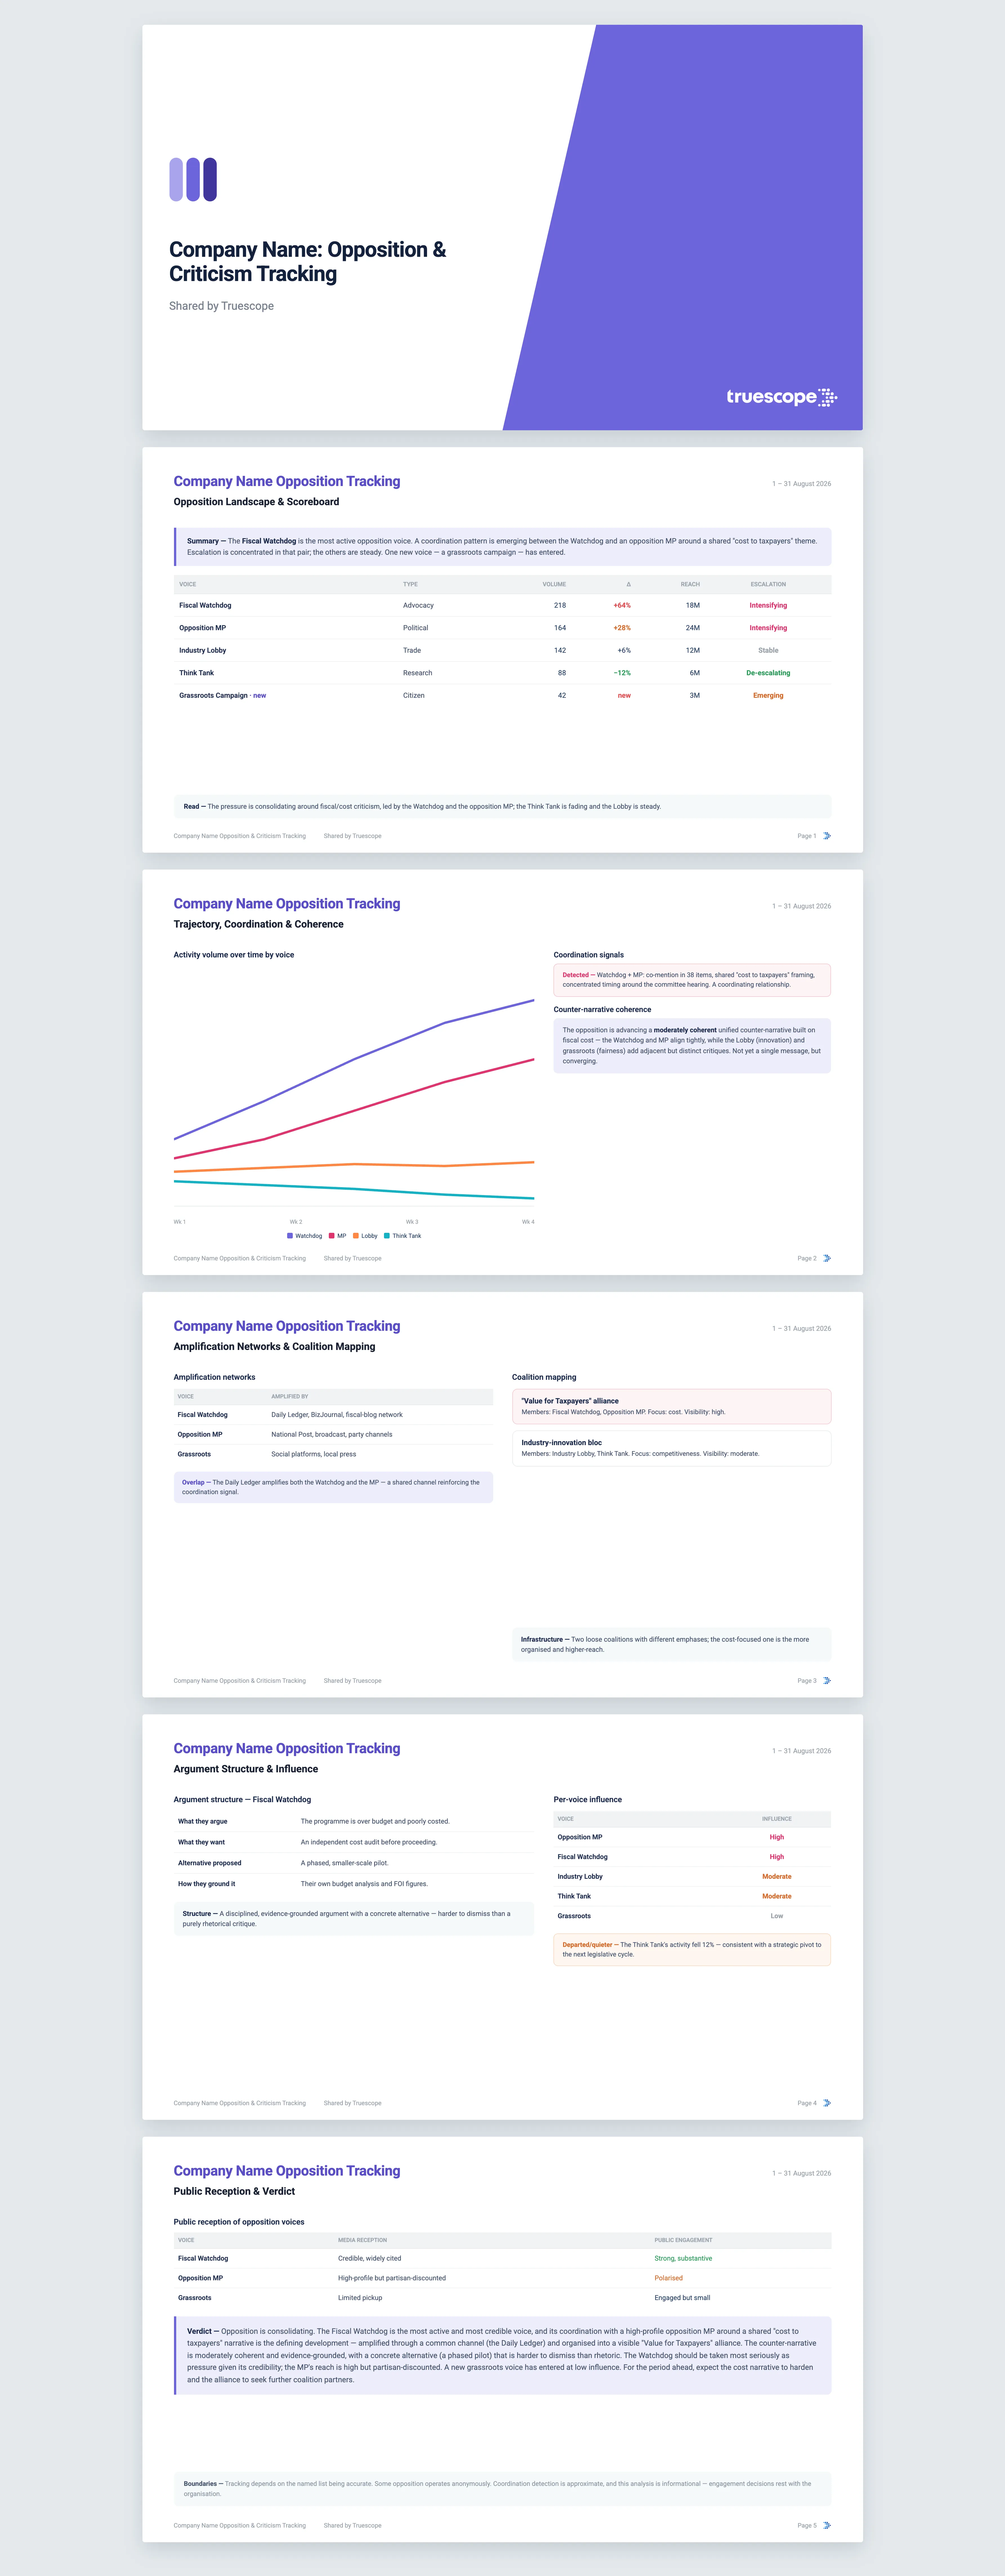
- Advocacy and reform voices, political framing of the service, trust and confidence indicators, and any operational metrics reported in coverage such as wait times or complaint rates.
- A service trajectory chart pairing coverage volume with net sentiment over the period, with a read on whether perception is stable, improving, or deteriorating.
Findings are benchmarked against the prior period where relevant, and every point traces back to the source coverage behind it.
Who it's for
This template is built for agency communications teams, programme directors, and public sector reputation managers who need to know how their service is landing with the people it serves. It also supports ministerial advisers and oversight bodies tracking whether a reform is being received as credible or met with scepticism.
Why Truescope Analyst
The traditional way to gauge this is a commissioned perception study or a manual sweep of complaints and clippings, both of which are slow, partial, and quickly out of date. Neither reliably separates an access problem from a fairness problem, or shows whether a regional pocket of frustration is spreading. A general AI tool offers no help, because it has no view of your live coverage and cannot map citizen experiences onto the service dimensions that drive perception.
Truescope Analyst reasons across your full media dataset, organises perception by the dimensions citizens actually use, and paraphrases citizen voice so you learn from it without exposing individuals. It is built into your subscription, available to everyone on the team, runs in minutes, and repeats on demand so you can watch trust rise or fall. Every finding is cited and traceable to source.
Frequently asked questions
What time period does it cover?
It analyses up to the last 13 months for coverage already in your Truescope inbox, or the last 90 days for global data not yet matched to your workspace, which is usually enough to see whether perception is trending or steady.
Can it break perception down by region or population group?
Yes. The report always includes a geographic perception view, and where you supply demographic dimensions it adds an equity section flagging whether concerns surface for particular groups. Government services frequently carry geographic and demographic equity dimensions, so this is often where the most actionable findings sit.
Does this tell me what every citizen thinks of the service?
No, and the report is explicit about it. Media-based perception captures the publicly visible conversation and tends to over-represent those who reach the media, often people with grievances. Aggregate citizen perception still needs polling and survey data.